Methods
The Public Health Institute of Western Massachusetts (PHIWM) launched the Western MA Youth Data Health Hub in 2026. The Hub was developed in partnership with a regional advisory group and built off the Western MA Youth Mental Health Roadmap published in 2024.
The process of selecting data points for the Hub began with a data subgroup of our regional advisory board. The subgroup identified a broad set of data points to help measure the five domains of the Western MA Youth Mental Health Roadmap.
Five Domains of the Western MA Youth Mental Health Roadmap
From there, PHIWM and the advisory group narrowed to a smaller set of data points to include in the launch of the Hub. We call these “metrics” because they are numerical values that help us track and understand youth mental and behavioral health.To arrive at this smaller set of metrics, we prioritized those where data were available across most, if not all, of Western MA. We also prioritized metrics that spoke to three factors:
- the mental and behavioral health of our young people,
- factors that support youth health, and
- factors that put young people at greater risk of having poor mental or behavioral health.
All metrics were drawn from youth health surveys, except for school absence data and youth gambling data.
School districts and organizations that conducted youth health surveys generously shared results with PHIWM. We used this information to develop metrics and create data visualizations, or “data vizzes”, that show the experiences of youth overall and across different groups. To complement the data vizzes, the Hub also highlights additional data, including state data where available, and trends from data collected over time.
We are committed to continuing to expand the Hub. If you are a surveying organization or school district interested in collaborating on this effort, please reach out to Lisa Ranghelli,
info@publichealthwm.org. We would love to add additional youth survey data to the Youth Health Data Hub to more fully represent our region.
Youth Health Surveys
Why do communities conduct their own youth health surveys when there is a statewide initiative?
At the state level, the Massachusetts Department of Public Health (DPH) and the Massachusetts Department of Elementary and Secondary Education (DESE) collaborate to administer the Massachusetts Youth Health Survey (MYHS) and the Massachusetts Youth Risk Behavior Survey (MYRBS). These surveys provide valuable information about young people across the Commonwealth. However, because of how the statewide data are collected, results cannot be analyzed or reported at the local level, such as by school district or city.
Prevention coalitions and other organizations need localized data to better understand and respond to community-specific needs. Because of this, many communities administer their own surveys to gather locally relevant data. Some efforts focus on one or a few school districts, while others survey across larger regions, such as a county. Organizations conducting these surveys often use different survey instruments (such as the Prevention Needs Assessment Survey) and may modify questionnaires based on local priorities and needs. As a result, survey questions are not the same across all school districts in Western Massachusetts.
Organizations that survey students across Western MA partnered with PHIWM to develop the Youth Health Data Hub by informing the Hub’s design and sharing youth data. They are featured as members of the Advisory Board and we include a description of their survey methods.
The values for our first set of metrics were based on the following data sets (years and survey specified):
- Berkshire County: 2024 Prevention Needs Assessment Survey (PNAS) data provided by Berkshire Regional Planning Commission on behalf of Northern Berkshire Community Coalition, Railroad Street Youth Project, and BRPC.
- Franklin County and North Quabbin: 2025 PNAS data provided by the Communities that Care Coalition.
- Hampshire County: 2025 modified PNAS data provided by the Strategic Planning Initiative for Families and Youth (SPIFFY) Coalition.
- Partial Hampden County:
- Chicopee 2024 modified Youth Health Survey (YHS)/Youth Risk Behavior Survey (YRBS) data provided by PHIWM with authorization from Chicopee Public Schools.
- Holyoke 2025 modified YHS/YRBS data provided by PHIWM with authorization from Holyoke Public Schools.
- Ludlow 2025 modified YHS/YRBS data provided by PHIWM with authorization from Ludlow Public Schools.
- Springfield 2025 modified PNAS and 2024 modified YHS/YRBS data provided by PHIWM with authorization from Springfield Public Schools on behalf of the
Springfield Survey Initiative.
Hub Geographies: Map of Regions Served by School Districts Surveyed
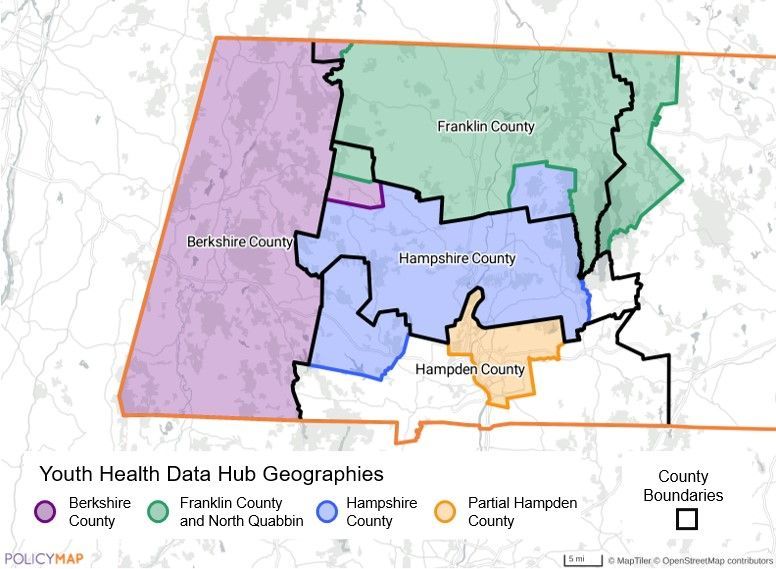
Besides Partial Hampden County, metric values for the Western MA counties include data from most (if not all) the public school districts in the county. Some public schools also serve students from a neighboring county. Learn more about which school districts are included in our metrics.
For each metric, we show a single percentage rather than displaying every response option. Some youth health survey questions were structured as yes/no questions and did not require additional processing. However, others had multiple response options. To show one value for these questions, we grouped responses into categories.
For example, the metric “Percent of students who did not go to school because they felt unsafe in the past month” is based on the youth health survey question, “During the past 30 days, on how many days did you NOT go to school because you felt unsafe at or on your way to or from school?” Students could answer “0 days,” “1 day,” “2-3 days,” “4-5 days,” or “6 or more days.” To create our metric, we combined all students who responded one or more days to calculate the percent of students who did not go to school due to safety concerns.
More details about how we grouped survey response options to create our metrics is available in our Data Dictionary. When possible, we used identical youth health survey questions (same question text and response options) to develop our metrics. Due to much variation in the surveys, we used similar, but not identical, questions to develop some of our metrics. This approach was only used when we determined that the differences were unlikely to meaningfully affect the student responses. In cases where variation in question text or response options varied too much to combine, we made two data visualizations to avoid comparison. Our Data Dictionary fully documents how each youth health metric was derived.
To protect student privacy and ensure data quality (results based on smaller numbers can vary widely), we suppressed (did not show) metric values with a small number of responses. For county-level data, we used the state of Massachusetts’ suppression criteria, not showing results when fewer than 5 students selected a specific response or fewer than 30 students responded to the question overall. For the Partial Hampden County values, we used a higher suppression threshold (fewer than 20 students selecting a specific response or fewer than 30 students answering the question) to align with school district methods. Despite more rigorous suppression rules, no data points in Hampden County needed suppression.
How are youth health survey data collected?
Many communities administer their own youth health surveys to gather locally relevant data. Each of these efforts is independent: organizations work with different school districts to survey students, on different timelines, and with different surveys. We provide an overview of the methods each organization used to collect their student survey data. We greatly appreciate their partnership in the development of the Youth Health Data Hub!
- The Berkshire Regional Planning Commission (BRPC), the Northern Berkshire Community Coalition (nbCC), and Railroad Street Youth Project (RSYP), collectively known as Berkshire Youth Development Project (BYDP), survey schools in Berkshire County every other year. In the second week of December 2024, nbCC, BRPC, and RSYP worked with Bach Harrison to administer the PNAS to 8th, 10th, and 12th grade students digitally during the school day in 11 school districts: North Adams, Northern Berkshire Vocational Regional, Hoosac Valley Regional, Mount Greylock Regional, Berkshire Arts and Technology Charter, Pittsfield, Central Berkshire Regional, Lee, Lenox, South Berkshire Regional, and Berkshire Hills Regional. The survey was available in both English and Spanish. Across schools, 87% of 8th graders, 71% of 10th graders, and 59% of 12th graders completed the survey (also known as the response rate). Not all students who participated completed the entirety of the survey. Bach Harrison performed consistency checks to eliminate surveys that met certain criteria indicating dishonest or inconsistent responses. Additional details can be found in the
2025 PNAS Report (note: report was published in 2025 with data collected in 2024).
- The Communities that Care (CTC) Coalition and Franklin Regional Council of Governments (FRCOG) survey schools in Franklin County and North Quabbin yearly, rotating between different surveys. In 2025, CTC and FRCOG worked with Bach Harrison to administer the PNAS to nine school districts: Athol/Royalston Regional, Four Rivers Charter, Franklin County Technical School, Frontier Regional, Gill-Montague Regional, Greenfield, Mohawk Trail Regional, Pioneer Valley Regional, and Ralph C. Mahar Regional. CTC and FRCOG administer the PNAS in this region every three years, within two weeks before February break. The 2025 survey was administered digitally during the school day to 8th, 10th, and 12th grade students and was available in both English and Spanish. Across schools, 73% of 8th graders, 70% of 10th graders, and 59% of 12th graders completed the survey. Not all students who participated completed the entire survey. Bach Harrison performed consistency checks to eliminate surveys that met certain criteria indicating dishonest or inconsistent responses. Additional details can be found in the
2025 PNAS Report and the
CTC Coalition’s website. To request additional information, including analyses, reports, or summaries, you can
submit a form to FRCOG.
- The Strategic Planning Initiative for Families and Youth (SPIFFY) Coalition, convened by the Collaborative for Educational Services (CES), surveys schools across Hampshire County every other year. In April 2025, SPIFFY conducted a modified version of the PNAS to 12 school districts. The districts included Amherst-Pelham Regional, Belchertown, Easthampton, Gateway Regional, Granby, Hadley, Hampshire Regional, Hatfield, Hilltown Cooperative Charter, Northampton, Smith Vocational and Agricultural High School, and South Hadley. The survey was administered digitally during the school day to 8th, 10th, and 12th grade students and was only available in English. Across schools, 77% of 8th graders, 67% of 10th graders, and 51% of 12th graders completed the survey. Not all students who participated completed the entire survey. SPIFFY contracted with Bert Rothenbach to do data cleaning. Bert Rothenbach performed consistency checks to eliminate surveys that met certain criteria indicating dishonest or inconsistent responses. Additional details can be found in 2025 topic specific reports on
CES’s website.
Prior years of PNAS reports are also available.
- The Public Health Institute of Western MA (PHIWM) works in partnership with public schools and other organizations in Hampden County to conduct youth health surveys. In Springfield, PHIWM alternates every other year between administering the PNAS and a modified YHS (for 8th graders) and YRBS (for 10th and 12th graders). Multiple years of data from PHIWM’s youth health surveys, across different public school districts, are included in the Youth Health Data Hub. These include:
- Modified YHS/YRBS in Chicopee administered in November 2024. Response rates: 8th grade 84%, 10th grade 78%, 12th grade 72%.
- Modified YHS/YRBS in Springfield administered in October 2024. Response rates: 8th grade: 80%, 10th grade 59%, 12th grade 58%.
- Modified YHS/YRBS in Holyoke administered in April 2024 (YRBS) and in May/June 2024 (YHS). Response rates: 8th grade 50%, 10th grade 57%, 12th grade 59%.
- Modified YHS/YRBS in Ludlow administered in April 2025. Response rates: 8th grade 82%, 10th grade 85%, 12th grade 80%.
- Modified PNAS in Springfield in December 2025. Response rates: 8th grade 68%, 10th grade: 50%, 12th grade: 38%.
PHIWM managed survey administration, and all surveys were completed electronically during the school day, in Alchemer with English and Spanish versions. Additional details can be found in
survey results and topic specific reports on
PHIWM's website.
School Attendance Dashboard
The Public Health Institute of Western Massachusetts developed a Tableau Dashboard in partnership with Dr. Mosca and their students in the Spring 2026 session of CSC/SDS 235: Visual Analytics at Smith College to visualize trends in middle and high school attendance across Western MA and Worcester County.
We used publicly available data from the Massachusetts Department of Elementary and Secondary Education (DESE) for the following metrics:
- Attendance Rate – Average percent of days students attended
- Average Number of Absences – Average number of student absence days
- Chronically Absent (10% or more) – Percent of students who were absent 10% or more of their enrolled school days
DESE provides data per school year by district and school across Massachusetts. Our team used DESE school attendance data, combined with
DESE school enrollment data, to provide county-level trends across school attendance in middle and high schools.
To calculate county-level values, we included all schools with data available for the most current year (2024–2025) which had students in grades 7th–12th; and, to exclude schools which were primarily elementary, we excluded schools where 2/3 or more of their students were in grades K–6th. We then determined county-level values of each metric by weighting to the population size of each school. Similarly, we determined overall values by weighting to the total population size of schools across all included counties.
Our team then visualized these metrics over time using Tableau, an interactive dashboard building tool. We want to thank Dr. Mosca and the Smith students who contributed to this project: Chiashi Yang, Victoria Reyes Borges, Kiara Sunil Singh, and other classmates who provided input and feedback to dashboard design.
If you are interested in learning more about school attendance, DESE provides additional documentation, as well as additional metrics across schools and districts in Massachusetts.
Youth Gambling Dashboard
Because we did not have data on youth gambling for Western MA counties, the Public Health Institute of Western Massachusetts developed a dashboard to visualize statewide youth gambling data over time.
We developed youth gambling metrics from the following question in the Massachusetts Youth Health Survey (MYHS): “During the past 12 months, how many times have you done any of the following for money or anything of value?”.
Our four metrics are how often in the last year young people engaged in the following behaviors:
- Lottery/Scratch Tickets
- Casino Gambling
- Fantasy Sports
- Any Form of Gambling (includes lottery/scratch tickets, casino gambling, fantasy sports, as well as these ‘other forms of gambling’: betting on sporting events, games of personal skill (e.g. pool, bowling, dominoes, or darts), dice games, horse or other animal races, video poker or other gambling machines, playing cards or bingo for money or prizes, and/or gambling on the internet.)
We developed an interactive dashboard showing values for each of these metrics over time using an application called Flourish. We show values separately for middle school students (6th – 8th) and high school students (9th-12th).
We accessed MYHS data for 2017, 2019, 2021, and 2023 from publicly available reports on the Massachusetts Department of Elementary and Secondary Education's website. We also included 2025 data provided from communications with the Massachusetts Department of Public Health.
Strategies & Research to Promote Youth Wellbeing
The Youth Health Data Hub includes a range of resources, such as reports, tools, campaigns, and descriptions of programs and strategies that support youth mental health and wellbeing.
- We identify resources through recommendations from the advisory group, suggestions submitted by community members, and materials we encountered through our ongoing work across the region.
- Our design team reviews resources for relevance to youth health and prevention, usefulness to our audiences, credibility, and alignment with public health and youth development values. For more complex decisions, we may seek guidance from the advisory group.
Including a resource in the Hub does not imply endorsement or independent verification of effectiveness. Instead, we aim to share a broad range of tools, strategies, and information to support learning, planning, and action across the region.
If you have questions, concerns, or suggestions for additional resources, we’d love to hear from you.